PlusToken
Executive Summary
Cryptocurrency market participants are becoming more sophisticated. Investors have an abundance of historical market data, simple and reliable price models, and on-chain metrics to help advise positioning.
Due to the relative youth of cryptocurrency markets, as well as some unique properties, there are special situations that can cause significant deviations from expected market behaviors.
For an example of such behavior, look no further than the recent rise and fall of the multi-billion dollar ponzi scheme, PlusToken, that reportedly amassed over 200,000 BTC in holdings.
Despite the massive size of the PlusToken scam, there has been very little in depth coverage of this topic from both western media and mainstream chain analysis firms.
This inaugural Special Situation Report will deliver the facts about PlusToken through the lens of on-chain bitcoin analysis, a powerful and unique fundamental trait of bitcoin.
Scope
The scope of this report is to cover the following:
- An assessment and review of real-world links to PlusToken's reported bitcoin addresses.
- How we discovered and tracked the movement of the PlusToken coins across various mixers.
- Methodology and verification of PlusToken's +200k BTC bitcoin hoard.
- An evaluation of PlusToken's impacts on the Bitcoin exchange rate due to acquiring and distribution of their coins.
- An assessment of the remaining impacts and suggestions for investors and traders who may be impacted by the movement of these coins.
PlusToken Overview
PlusToken was a popular high yield investment scam operating largely in China, South Korea, and Japan. The scam went relatively unnoticed in the west while drawing in a self-reported [1] 2.4 to 3 million users and a reported hoard of 200,000 BTC.
PlusToken was the first multi-billion dollar cryptocurrency ponzi scheme.
During peak operations, PlusToken had all the social engineering hallmarks of a typical scam including:
- promised double digit monthly returns
- aggressive marketing
- and a referral program
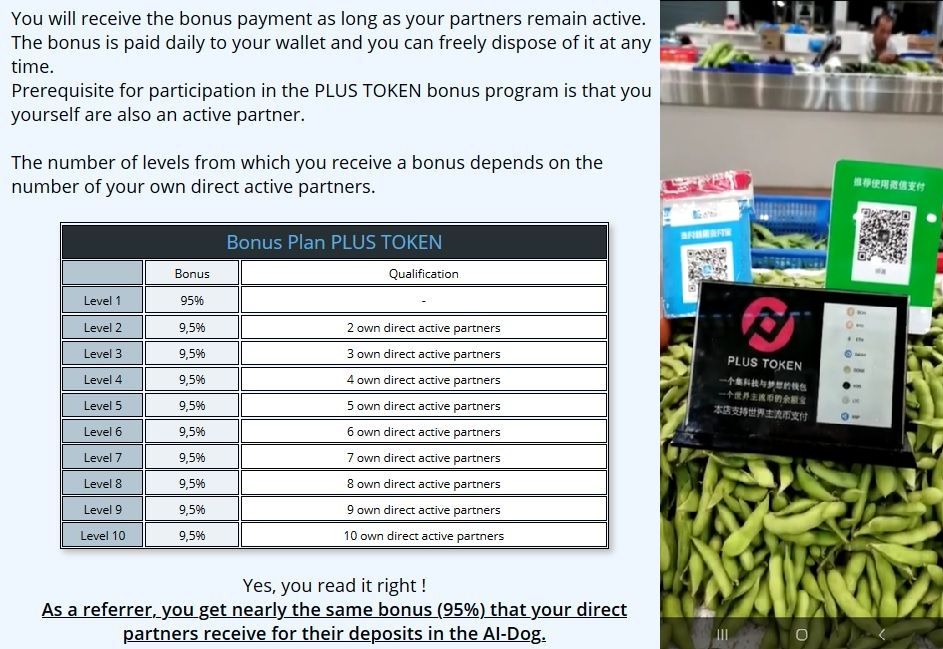
Unsuspecting users were prompted to lock various cryptocurrencies including Bitcoin, Ethereum, Ripple, and EOS into the custodial PlusToken Wallet. In return, they were promised high returns generated by an arbitrage trading algorithm (AI-Dog), stake in a "decentralized" ETH token (PlusCoin), and referral rewards.
Timeline
Details surrounding the scam are relatively sparse in Western media, but a rough timeline sourced from various PlusToken related sources is presented below:
February 2018
150,000 ETH private offering [4] and white paper launch [5] .
April 2018
Launch of multi-country operations.
September 2018
PlusCoin ICO [6], open trading and beta/VIP round.
Early 2019 - June 2019 - Proliferation
- A reported amassing of 200,000 BTC [7] or approximately 1% of the total bitcoin supply
- 50% of PlusToken ETH [8] withdrawals were sent to Huobi exchange
27 June 2019 - Collapse
Characterized by the arrest of 6 Chinese citizens [9] in Vanuatu and permanent shutdown of the wallet's servers resulting in lockdown of user funds
Late June to Early August - Dormancy
Minimal movement of BTC in our PlusToken Wallet Cluster
7 August to present - Distribution
Attempted hiding of the movement of PlusToken coins and distribution largely to Huobi
PlusToken Blockchain to Real-World Links
The most difficult and arguably most important part of a reliable analysis of an entity's blockchain movements is establishing reliable links to the entity and bitcoin addresses they control.
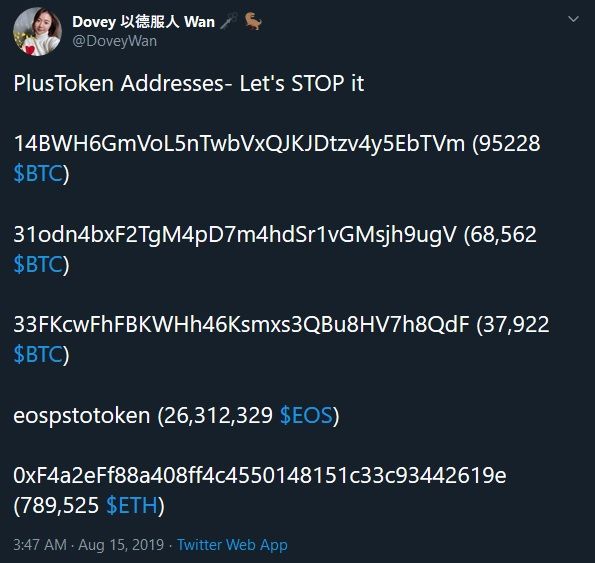
The first major reporting on links to PlusToken addresses was completed by Dovey Wan across several tweet threads. She attained multiple screenshots from PlusToken Telegram chats documenting user reported addresses.
Her work captured three of the most significant addresses in the overall PlusToken cluster and was the basis for additional transaction graph evaluations completed by PeckShield [13] and Token Analyst [14]. These studies were the basis for our original analysis of the mixing of PlusToken coins.
Address Labeling
Address labeling is always somewhat subjective, but additional observations can be used to further validate an ownership thesis. Due to the recent increase in interest in the PlusToken saga, we completed additional research [15] to improve our confidence in the previously reported addresses.
Our analysis verified several PlusToken deposit and withdrawal addresses provided by users in YouTube tutorials. Coins from the provided user addresses were either sent to or sourced from our overall PlusToken wallet cluster.
| Address | Amount Received |
|---|---|
| 31odn4bxF2TgM4pD7m4hdSr1vGMsjh9ugV | 68,500 BTC |
| 1MphtpYJv5E7MmL6y7Ys7doD2cN5w5Hyr3 | 3,700 BTC |
| 14BWH6GmVoL5nTwbVxQJKJDtzv4y5EbTVm | 101,500 BTC |
| 1B67M6ABnwJ6nrbWx7RyAEqZiu8qwUZgeV | 234,400 BTC |
Our research generally confirms the addresses originally provided by Dovey Wan and lends further proof that our overall cluster was in fact controlled by PlusToken.
The Cluster Grows
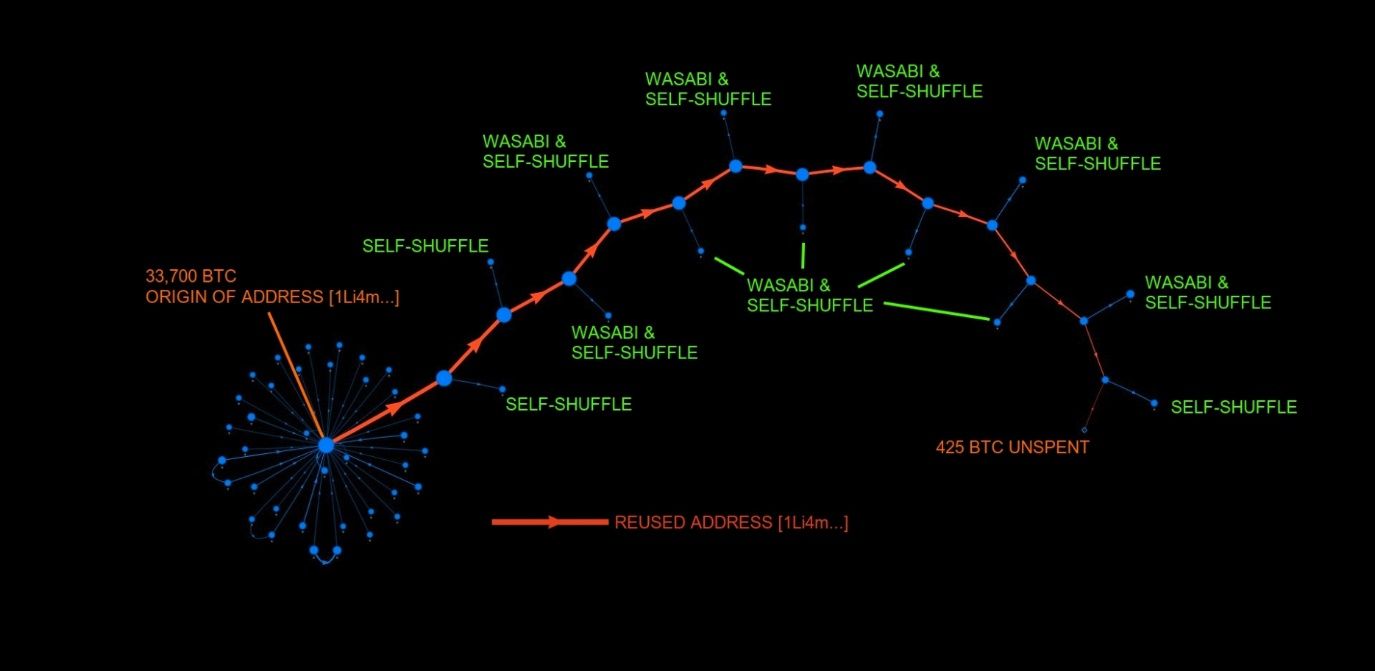
Figure 4, below, is a simplified diagram of our PlusToken wallet cluster. It shows the major premix addresses and clusters, as well as the mixer inflows noted during our analysis.
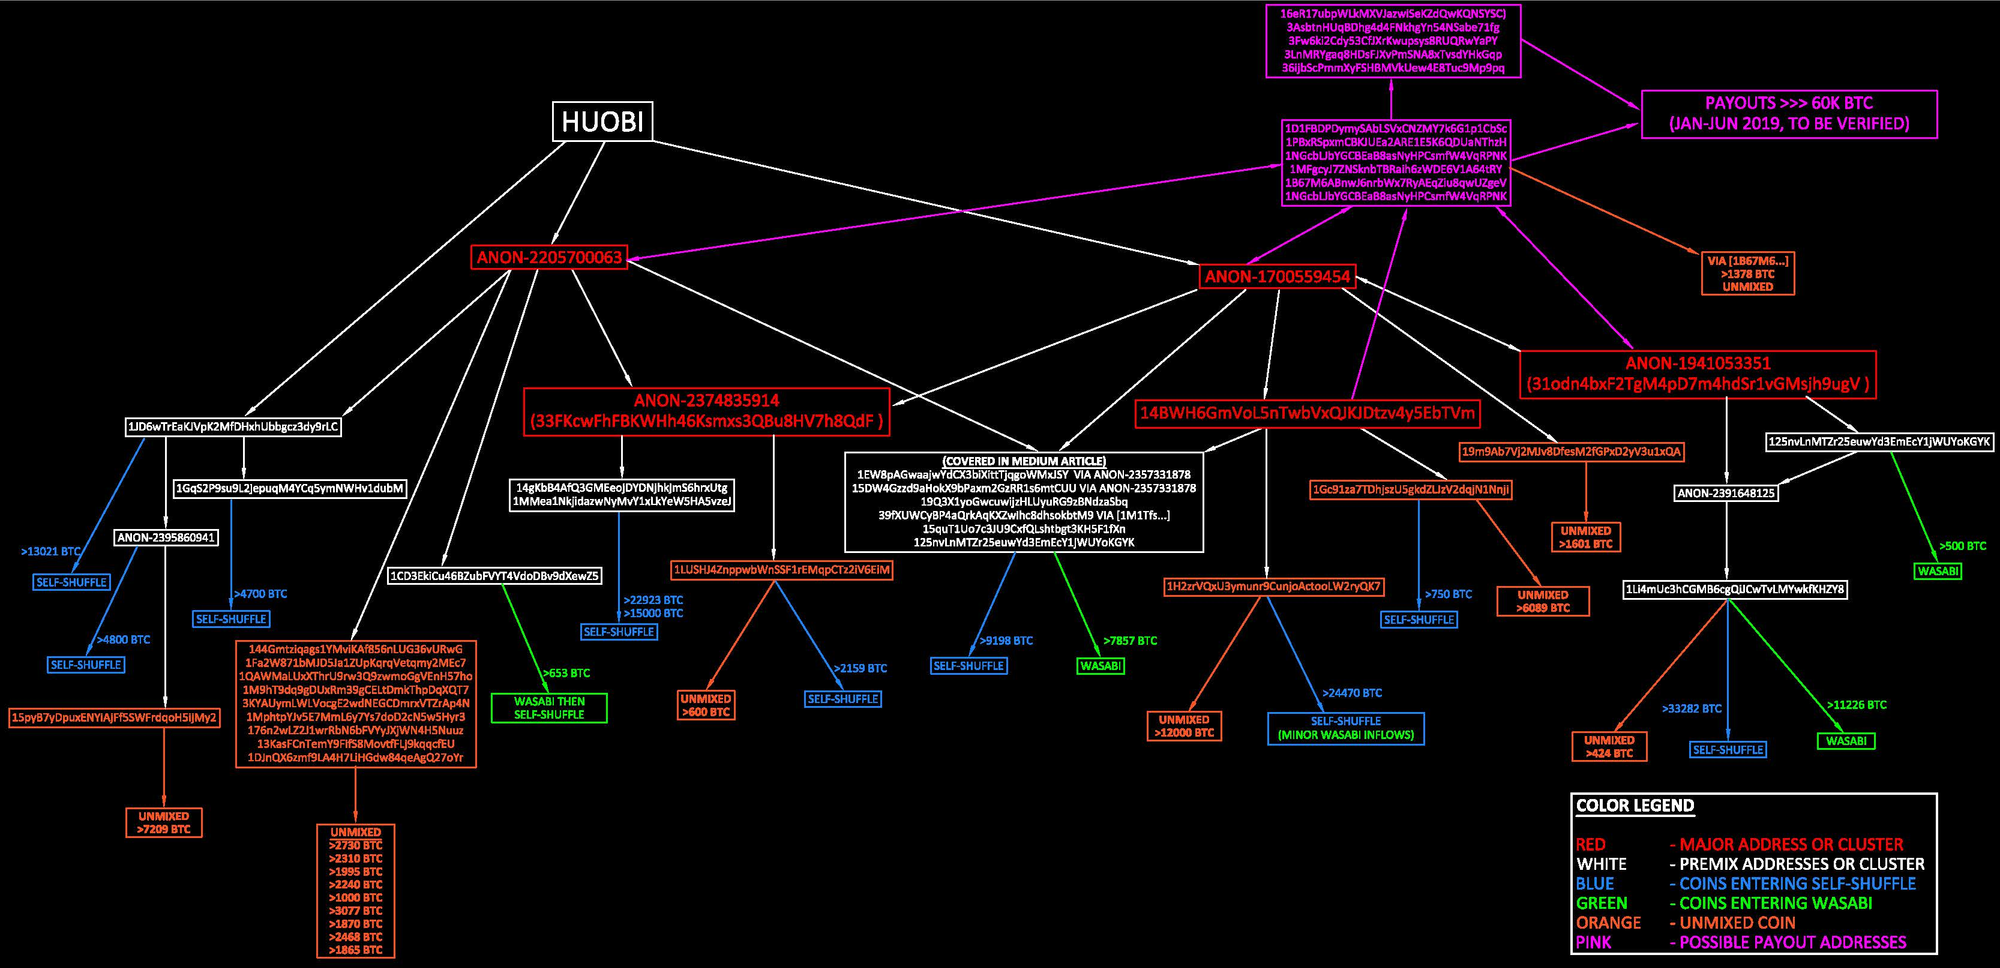
Several of the addresses in our cluster had peak balances of over 20,000 BTC. Prior to distribution, these addresses would have placed squarely in the Top 50 bitcoin address rich list [16] (minimum balance at time of writing for the Top 50 is 14,500 BTC).
We estimate PlusToken's post-shutdown wallet cluster total at around 187,000 BTC.
Blockchain Analysis Overview
Bitcoin's permissionless properties allow for easy scamming of funds without the hang-ups provided by the traditional banking system. But, the negative privacy aspects of bitcoin mentioned below allow for easy monitoring of the movement of stolen funds.
This presents a problem for scammers who must attempt to hide the movement of funds in order to cash out.
Bitcoin inputs and outputs are paid to or from transparent addresses in transparent amounts, making the tracking of coin movements relatively easy. One common analysis tool is the construction of a transaction graph for evaluating bitcoin flows. An example transaction graph sourced from OXT.me can be found below.
A common blockchain analysis method allows for the clustering of separate addresses and assumption of common ownership by the merged input heuristic. The merged input heuristic is very powerful and usually correct.
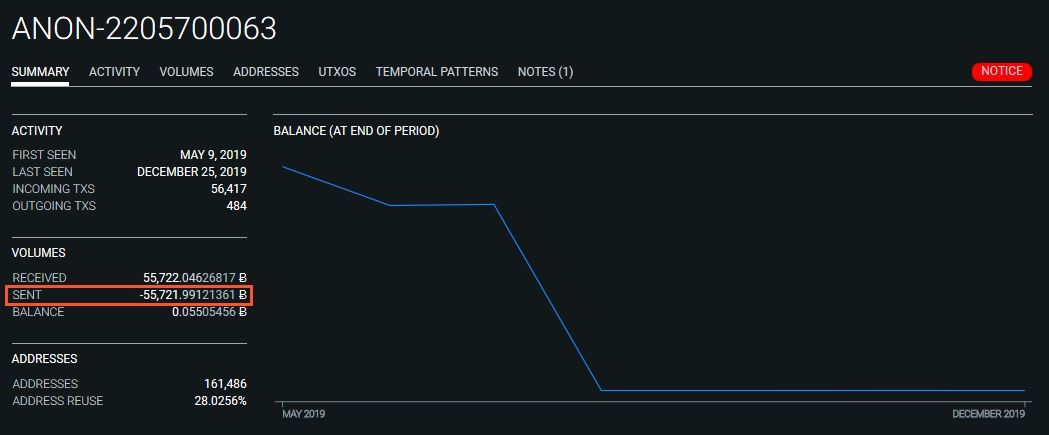
OXT is one of the few research platforms with a publicly available clustering feature. Cluster data is accessible via OXT for review and verification of our analysis.
One of the large clusters (ANON-220570063) [17] in our overall PlusToken cluster is shown below. This cluster includes over 160,000 addresses and has received nearly 56,000 BTC.
Introduction to Mixing.
Attempts to hide the movement of bitcoins is typically performed by using bitcoin tumblers or mixers. "Tumbler" is a common term for custodial mixers. These provide high levels of blockchain privacy at the risk of tumblers walking off with user funds.
Some blockchain analysts consider exchanges as another form of custodial tumbler. User funds can enter one hot wallet and leave a separate wallet, which breaks linkage of fund transfer.
There are also non-custodial mixing services such as JoinMarket, Wasabi Wallet, and Samourai Wallet's Whirlpool. When implemented properly, non-custodial mixers can provide a level of basic, but not perfect, bitcoin transaction privacy.
Attempted Mixing of PlusToken Coins
Bitcoin's transparent blockchain presents a problem for cashing out of stolen funds. To avoid these problems, funds are typically processed through "mixers" or "tumblers" before movement to exchanges.
During our original analysis of PlusToken's movements, we noted mixing of funds via two distinct methods:
- The Wasabi Wallet mixer
- A simple algorithmic mixing process we termed "self-shuffling"
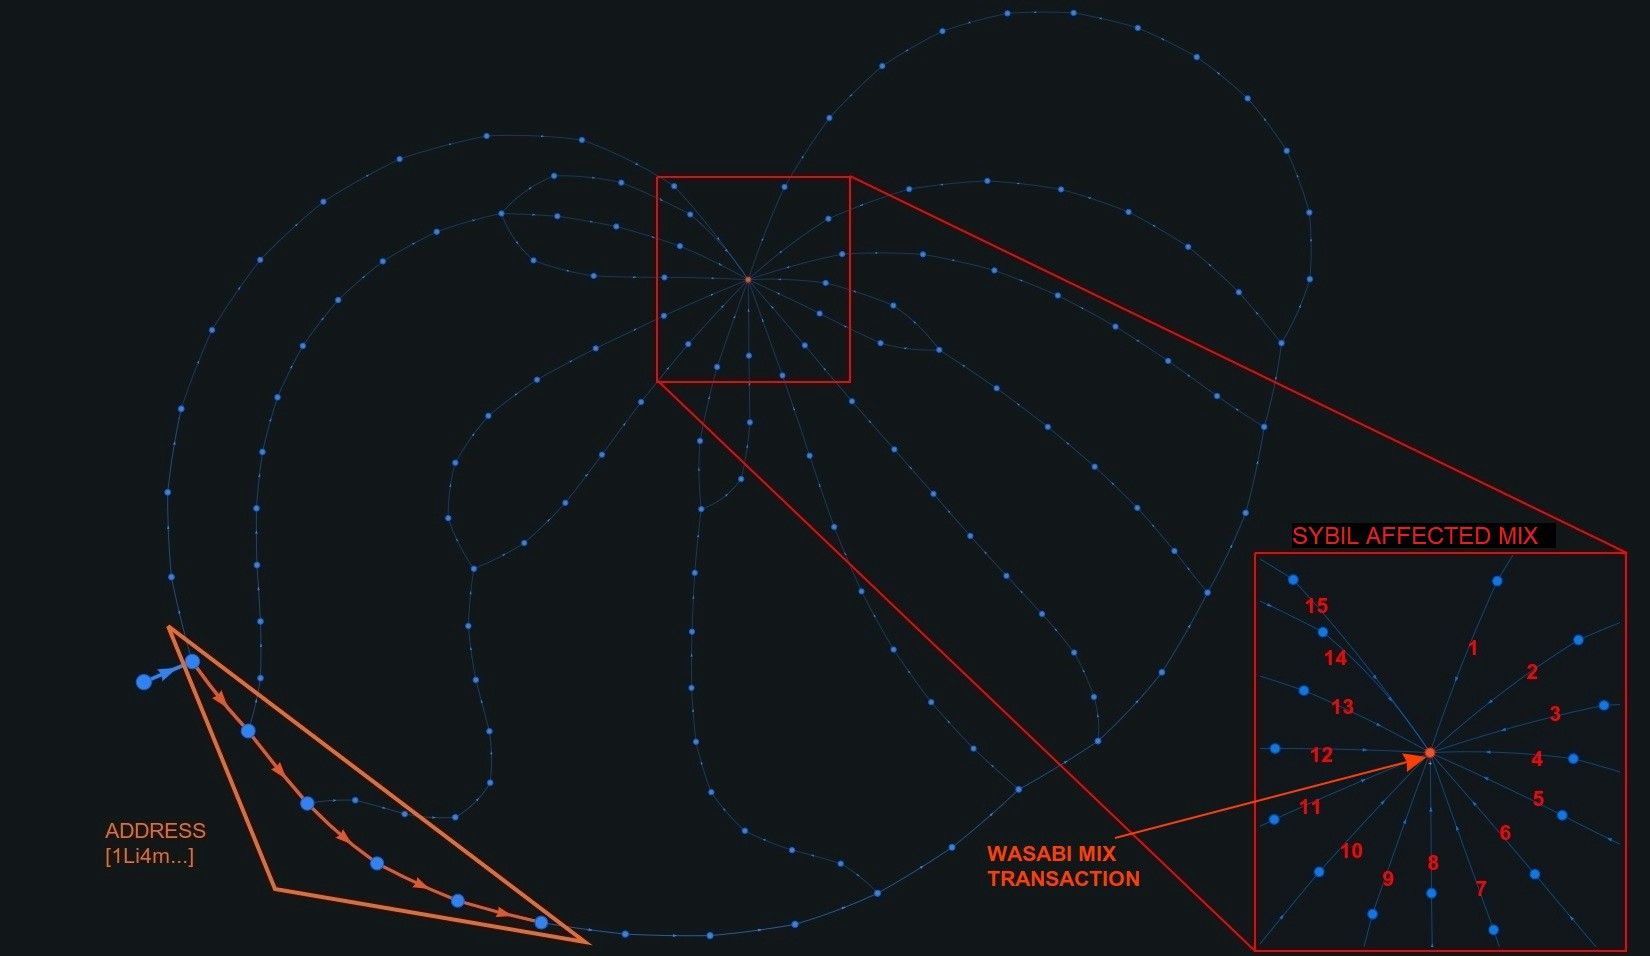
Our original analysis [18] was triggered as a result of abnormally high address reuse among Wasabi mixer outputs. This behavior eventually led to the discovery of an active Sybil attack on the Wasabi mixer. The source of the Sybil attack traced back to addresses reportedly controlled by PlusToken.
Flawed Mixing Leads to De-anonymization
We were able to de-anonymize PlusToken's movement of funds across the Wasabi mixer due to various sub-optimal mixing practices
Coordinator address reuse
The mixing coordinator takes a fee for providing mixing services into a static bitcoin address, which makes monitoring incoming volume trivial.
Abnormal incoming volume
Large injections of BTC into the mixer from PlusToken controlled addresses into the mixer.
Merging
The merging of abnormally large BTC volumes upon exiting the mixer
Single round mixing
A timing analysis of funds deposited into the mixer reveal coins typically, were only mixed for a single round.
Approximately 19,700 BTC of PlusToken controlled funds were processed through the Wasabi Mixer during a period from early August through late-September.
Self Shuffling Leads to De-anonymization
The controller of the PlusToken coins also attempted to hide the movement of funds by a process we have termed "self-shuffling".
This process is not technically considered mixing but appears to be a simple algorithmic obfuscation technique of repeated UTXO splitting and merging in hundreds of transactions. The majority of PlusToken's funds have been "mixed" by this method.
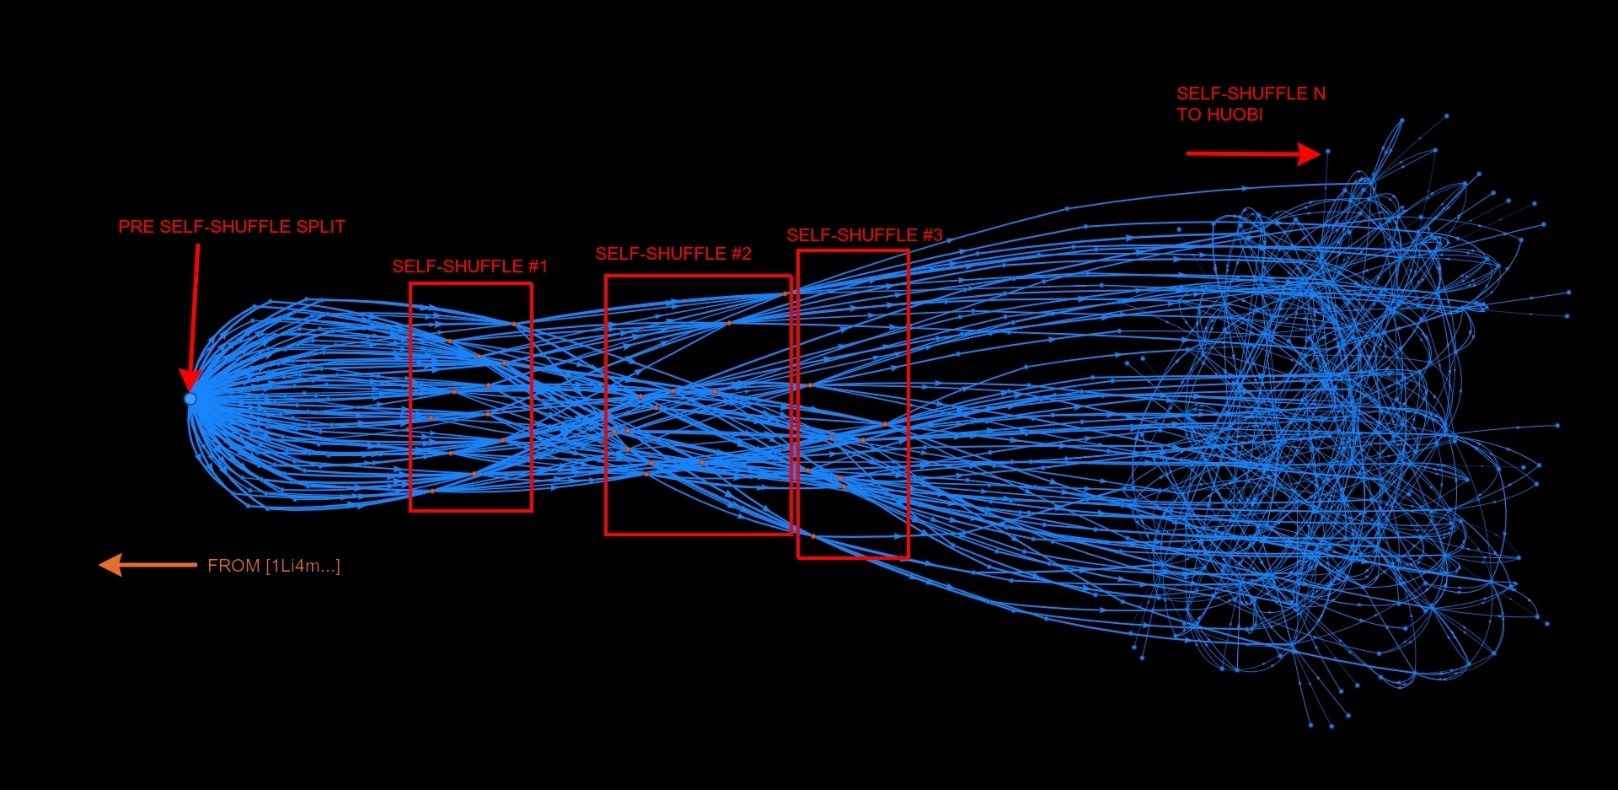
Upon exiting the self-shuffling process, the previously split UTXOs are merged into large transactions, usually within the same block. Distribution of self-shuffled coins is still ongoing.
Additional details on our process for tracking of mixed funds can be found in our 23 October medium article [19] and Stephan Livera Podcast Episode 130 [20].
Evaluating PlusToken's Hoard
With the potential for such a massive volume of coins controlled by PlusToken, we believed this may have had an impact on the current bitcoin market cycle.
In our original analysis, we accounted for around 55,000 BTC that were mixed by PlusToken, a significant difference from the 200,000 BTC hoard reported elsewhere.
The 200,000 BTC totals originated from a relatively simplistic analysis based on the total BTC received by a handful of PlusToken addresses.
During our October analysis, we noted a significant amount of self-transfer between addresses in the overall PlusToken cluster. The self-transfer can cause a simplified analysis to count the same coins multiple times, producing an inflated coin estimate.
Targeted Analysis
Rather than using totals from addresses and clusters in our overall analysis, we performed a targeted analysis of the post-shut down coin totals based on two simplifying assumptions
Funds transferred prior to 27 June were ignored
This allows us to avoid having to account for "payouts" and focus our total on the coins controlled by PlusToken after shutdown.
Total funds were based on mixer inflows
This mitigates the self-transfer problem inherent in a simplistic overall analysis.
Results
A visual representation of our overall PlusToken cluster is shown in Figure 4, above. A tabulated version of the overall cluster is provided in Table 2, below.
138,800 BTC
Mixed or remain in the mixing process
48,800 BTC
Unmixed — We expect that the unmixed coins have not been lost and will eventually be distributed on the market.
Our analysis puts the total PlusToken hoard post 27 June at around 187,600 BTC.
| Major Source | Sub Source | Mixed | Current Balance | Total |
|---|---|---|---|---|
| REFINED MEDIUM ARTICLE ANALYSIS (Posted 23-Oct-19) Active Dates: 2-Aug-19 to 20-Sep-19 First Mix Noted 7-Aug-19 |
1EW8pAGwaajwYdCX3biXittTjqgoWMxJSY | 2,466 | 2,466 BTC | |
| 15DW4Gzzd9aHokX9bPaxm2GzRR1s6mtCUU | 2,460 | 2,460 BTC | ||
| 19Q3X1yoGwcuwijzHLUyuRG9zBNdzaSbq | 3,400 |
3,400 BTC | ||
| 1CD3EkiCu46BZubFVYT4VdoDBv9dXewZ5 | 630 | 630 BTC | ||
| 39fXUWCyBP4aQrkAqKXZwihc8dhsokbtM9 VIA: 1M1TfsvbmJD5CVhrwXsidRrpVrXY8f5rGU |
5,776 | 5,776 BTC | ||
| 15quT1Uo7c3JU9CxfQLshtbgt3KH5F1fXn | 2,453 | 2,453 BTC | ||
| 125nvLnMTZr25euwYd3EmEcY1jWUYoKGYK | 500 | 500 BTC | ||
| 1Li4mUc3hCGMB6cgQiJCwTvLMYwkfKHZY8 | 33,282 | 424 | 33,706 BTC | |
| 1H2zrVQxU3ymunr9CunjoActooLW2ryQK7 | 24,470 | 12,000 | 36,470 BTC | |
| ANON-2205700063 (Not Included in Original Analysis) Active Dates: 9-Aug-19 to 6-Sep-19 |
144Gmtziqags1YMviKAf856nLUG36vURwG | 2,730 | 2,730 BTC | |
| 1Fa2W871bMJD5Ja1ZUpKqrqVetqmy2MEc7 | 2,310 | 2,310 BTC | ||
| 1QAWMaLUxXThrU9rw3Q9zwmoGgVEnH57ho | 1,995 | 1,995 BTC | ||
| 1M9hT9dq9gDUxRm39gCELtDmkThpDqXQT7 | 2,240 | 2,240 BTC | ||
| 3KYAUymLWLVocgE2wdNEGCDmrxVTZrAp4N | 1,000 | 1,000 BTC | ||
| 1MphtpYJv5E7MmL6y7Ys7doD2cN5w5Hyr3 | 3,077 | 3,077 BTC | ||
| 176n2wLZ2J1wrRbN6bFVYyJXjWN4H5Nuuz | 1,870 | 1,870 BTC | ||
| 13KasFCnTemY9FifS8MovtfFLj9kqqcfEU | 2,468 | 2,468 BTC | ||
| 1DJnQX6zmf9LA4H7LiHGdw84qeAgQ27oYr | 1,865 | 1,865 BTC | ||
| ANON-2374835914 (Not Included in Original Analysis) Active Dates: 13-Aug-19 to 2-Sep-19 |
1MMea1NkjidazwNyMvY1xLkYeW5HA5vzeJ | 15,000 | 15,000 BTC | |
| 14gKbB4AfQ3GMEeojDYDNjhkjmS6hrxUtg | 22,923 | 22,923 BTC | ||
| 1LUSHJ4ZnppwbWnSSF1rEMqpCTz2iV6EiM | 2,159 | 600 | 2,759 BTC | |
| NEWLY ACCOUNTED FOR ADDRESSES Active Dates: 22-Aug-19 to 20-Sep-19 |
19m9Ab7Vj2MJv8DfesM2fGPxD2yV3u1xQA | 1,601 | 1,601 BTC | |
| 1B67M6ABnwJ6nrbWx7RyAEqZiu8qwUZgeV | 1,378 | 1,378 BTC | ||
| 1Gc91za7TDhjszU5gkdZLJzV2dqjN1Nnji | 750 | 6,089 | 6,839 BTC | |
| 1JD6wTrEaKJVpK2MfDHxhUbbgcz3dy9rLC | 17,821 | 17,821 BTC | ||
| 1GqS2P9su9L2jepuqM4YCq5ymNWHv1dubM | 4,700 | 4,700 BTC | ||
| 15pyB7yDpuxENYiAjFf5SWFrdqoH5ijMy2 | 7,209 | 7,209 BTC | ||
| SUBTOTALS | 138,790 | 48,856 | 187,646 BTC | |
Payout Addresses
We also encountered several addresses that appeared to be dedicated to "payouts". These addresses were fairly active in the spring of 2019 up to 27 June 2019.
In total, these addresses sent approximately 90,000 BTC, again with a notable amount of self-transfer between addresses in the overall cluster. Payouts were also noted from additional addresses in our overall cluster.
| Address |
|---|
| 3LnMRYgaq8HDsFJXvPmSNA8xTvsdYHkGqp |
| 3AsbtnHUqBDhg4d4FNkhgYn54NSabe71fg |
| 3Fw6ki2Cdy53CfJXrKwupsys8RUQRwYaPY |
Conservatively, we estimate at least 60,000 BTC in payouts or transfers to exchanges during 2019.
Including the previously distributed coins in our overall total, puts estimates for the PlusToken BTC hoard at approximately 250,000 BTC, well over 1% of the total Bitcoin supply.
Evaluating PlusToken's Coin Distribution
Address reuse has been common throughout the movement of PlusToken funds. As a result, we have been able to track the majority of mixed funds.
Though earlier reports indicated distribution of PlusToken coins to various exchanges, we have only noted a few significant coin destinations including:
Huobi
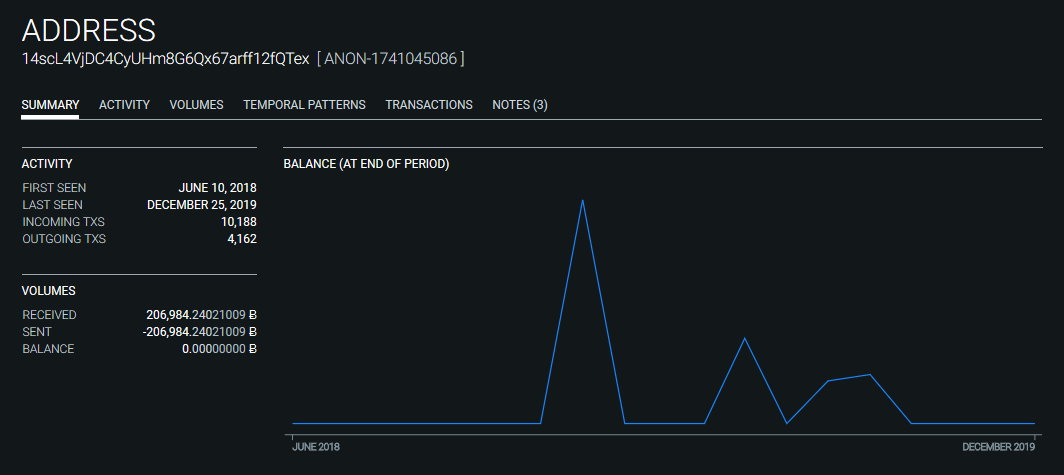
The majority of post-mix distributions are processed through Huobi hot wallets
14scL4VjDC4CyUHm8G6Qx67arff12fQTex
Possible Investment Fund Wallet or OTC Desk
ANON-792097335
Possible Huobi Cluster
ANON-1601074884
Possible Huobi Cluster
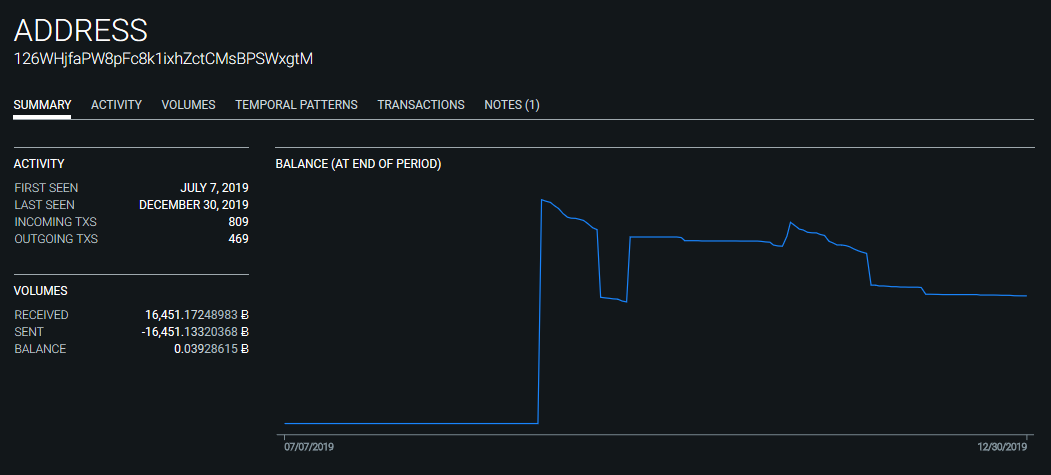
The most significant post-mix reused address is [126WHj...], which has received a significant number of transactions from PlusToken coin distributions and is likely a Huobi controlled address. Address [126WHj...]'s history has allowed us to account for the majority of PlusToken's post-mix distributions.
Defining Distribution
It's worth noting that we are not watching Huobi's order books and use the term distribution to specifically refer to the transfer of PlusToken funds to the wallets noted above.
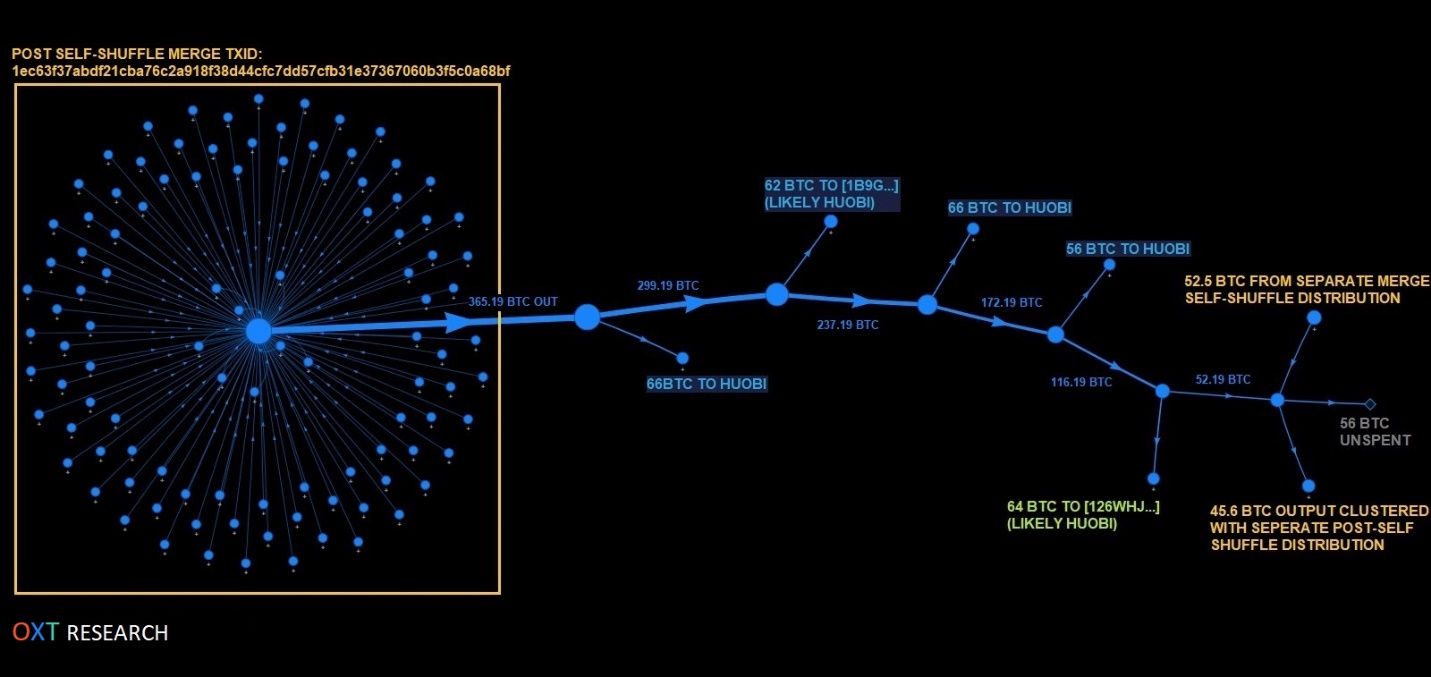
The typical distribution process is as follows:
- Mix (mostly via self-shuffling)
- Merging of mixed outputs into a single large transaction, typically of 100 to 400 BTC.
- Merged mix outputs are processed in batches of roughly 15 "simultaneous" distributions.
- Each merged mix output is distributed in a peeling chain with payments of 30+ BTC to the entities noted above.
- After a majority of the coins from a distribution chain have been transferred, the leftover coins are then merged with other distribution chains and distributed.
We believe that approximately 139,000 BTC have been mixed since early August. So far we have accounted for 105,600 post-mix BTC that have been distributed. Our distributed and distributing totals account for roughly 80% of mixed coins.
| Dates | Destination | Mix Source | BTC Distributed |
|---|---|---|---|
| 14-Aug-19 to 25-Aug-19 | 1LiDBLEVpiYd9P7zGkoumVfXFq79UnEB8D | Combination | 2,636 |
| 5-Sep-19 to late November | Via [126WHj...] | Self Shuffle | 83,243 |
| 5-Sep-19 to Present | Wasabi PostMix Cluster (adj. for [126WHj...]) | Wasabi | 3,441 |
| 5-Sep-19 to Present | Main Wasabi PostMix Cluster | Wasabi | 11,162 |
| 2-Sep-19 to 11-Sep-19 | Unaccounted for Wasabi Inflows (Assumed Distributed) | Wasabi | 5,133 |
| Early August to Present | CURRENTLY MIXING - ESTIMATED | Self Shuffle | 4,000 |
| Present | Current Distribution Batch - DISTRIBUTED | Self Shuffle | 2,409 |
| Present | Current Distribution Batch - DISTRIBUTED | Self Shuffle | 2,987 |
| DISTRIBUTED SUBTOTAL | 105,615 | ||
| ACCOUNTED FOR (DISTRIBUTED+DISTRIBUTING+MIXING EST.) | 115,011 | ||
| NOT ACCOUTNED FOR (MIXER INFLOWS - DISTRIBUTED SUBTOTAL) | 23,779 | ||
Including the remaining coins in the current distribution batch and a lower bound estimate of 4,000 BTC suspended in mixing leaves approximately 24,000 BTC unaccounted for. We expect that some of the unaccounted for coins have been distributed, so our unaccounted for coins represent an upper bound of coins that have been mixed but not distributed.
Examining Huobi's Cold Storage
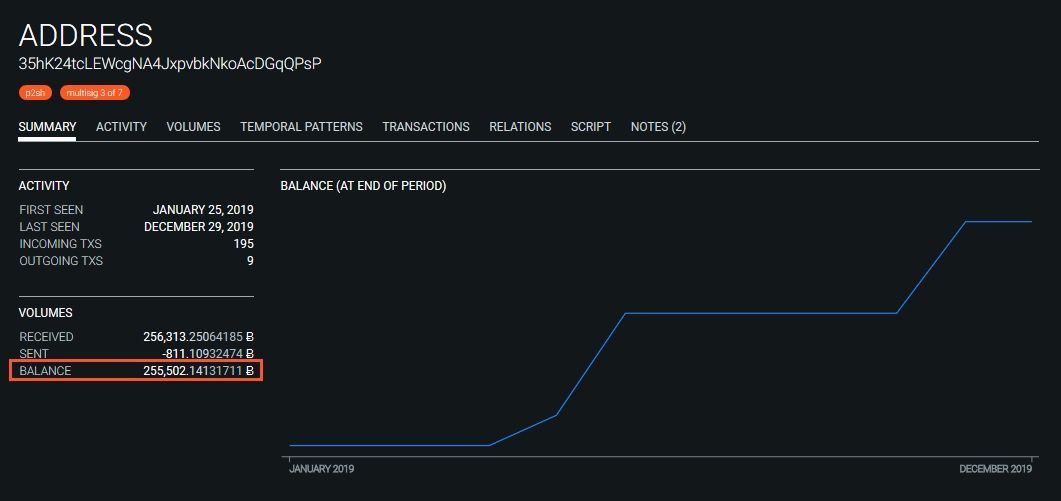
Additional evidence for our +100k BTC distribution total can be found by observing Huobi's total assets. Particularly Huobi's multi-signature cold storage address [21]
This address has recently become the "richest" bitcoin address. While this does not prove the distribution of all of the PlusToken coins, it is an additional data point indicating Huobi is the majority destination of these coins.
| Unmixed (Pre-Mix) Coins | 48,856 | ||
|---|---|---|---|
| Current Distribution Batch - Undistributed | 2,987 | ||
| Estimate of Currently Mixing Coins (Lower bound / Upper bound) | 4,000 | 24,000 | |
| Remaining PlusToken BTC (estimates) | 55,843 BTC | 75,843 BTC | |
Based on the pre-mix coin totals and our unaccounted for coin estimates, we believe between 55,000 BTC and 75,000 BTC remain to be distributed.
Potential Market Impacts
The implications of a single entity amassing nearly 1% of the total BTC supply in a short period of time seem fairly obvious in their effects on the bitcoin exchange rate.
PlusToken Inflows
There is a significant amount of self-transfer between addresses and clusters in our overall PlusToken cluster. A simplistic analysis of total BTC received to these addresses will produce an inflated estimate of overall BTC totals and inflows. Instead we will use our net cluster total to evaluate PlusToken's overall inflows.
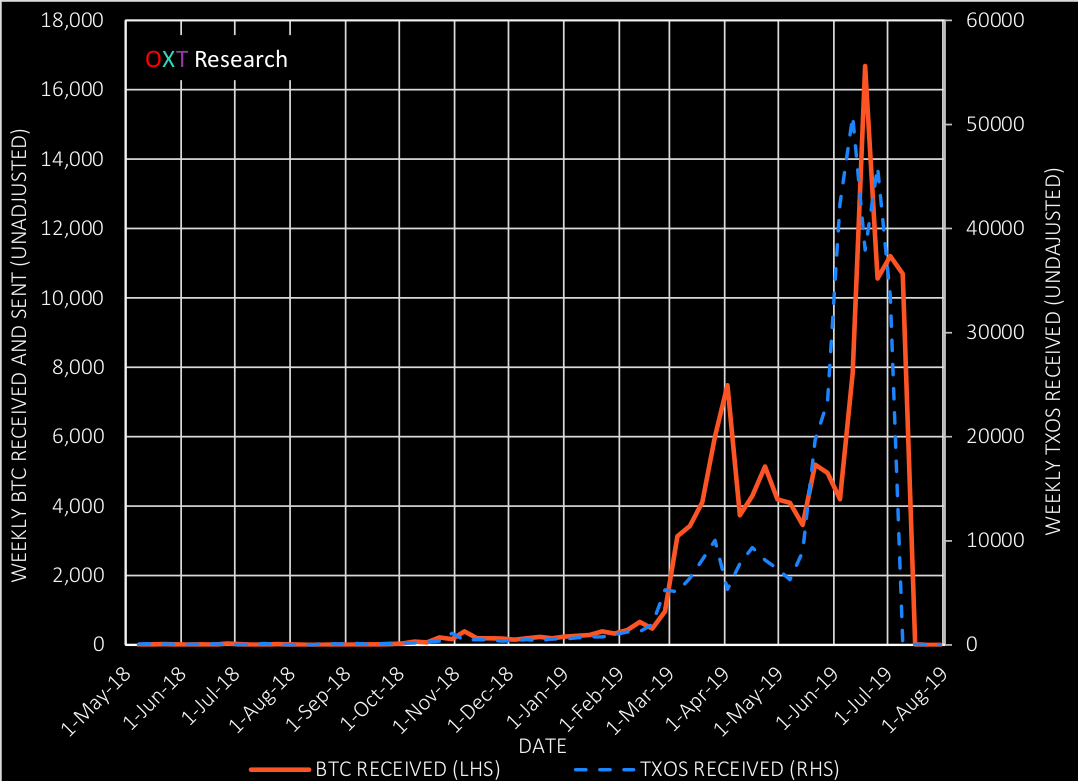
To evaluate PlusToken's most active time period, we will focus on the two largest wallet clusters in our overall wallet cluster, ANON-1700559454 and ANON-2205700063 .
The figure below shows the weekly BTC and UTXOs received by these clusters. Again, these figures suffer from some self-transfer inflation, but we believe the trends are representative of peak activity level and time frame.
The linear plot below clearly demonstrates an exponential growth in PlusToken activity beginning in 2019. Exponential trends are either misleading or unsustainable. While we acknowledge the deficiencies in these proxy metrics we lean towards the latter as a proper assessment of PlusToken's activity.
While the inflow data into the overall PlusToken cluster is difficult to evaluate, we can make some reasonable assumptions about inflows based on the timing indicated by the cluster activity above.
For this analysis we will use the net BTC totaled in the PlusToken cluster as defined by post-shutdown mixer flows (187,000 BTC). This discounts any outflows over the time period. We will focus on two time frames, overall and the most active period which we will define as 1 February through 27 June 2019.
Table 6, below shows our inflow estimates for both time periods.
| Timeframe | Dates | Duration (days) | BTC Accumlated | Accumulaton Rate (BTC/day) |
|---|---|---|---|---|
| Overall | 1-May-18 to 27-Jun-19 | 477 | 187,000 | 392 |
| Active (2019) | 1-Feb-19 to 27-Jun-19 | 146 | 1281 |
It's noteworthy that BTC inflows into the two PlusToken clusters above continued their exponential growth despite the +200% BTC price increase from April to late June.
There is likely a reflexive relationship between the BTC exchange rate increases and PlusToken participant psychology. In other words, price rises drive additional ponzi/speculative behavior which drives additional inflows and price rises.
Net inflows were likely significantly higher than our average during peak activity in May and June.
Assuming a negligible net 2018 inflow, results in inflows of approximately 1200 BTC per day for our February through June 2019 active time frame. This translates to roughly 65% of the daily mining block reward distribution offset by PlusToken inflows.
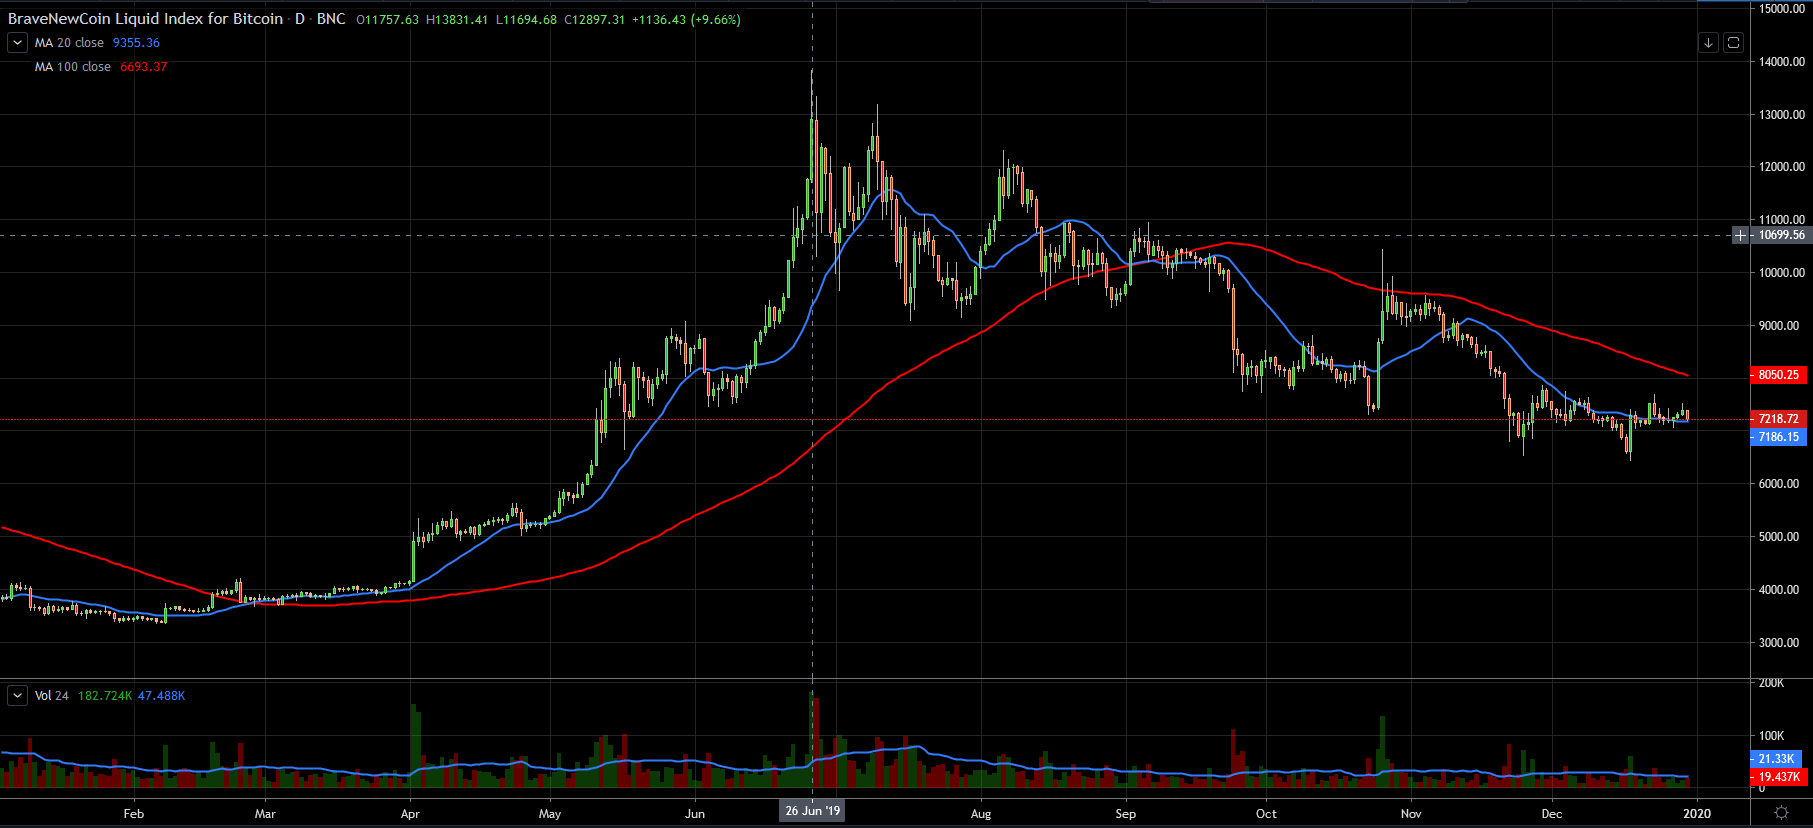
Off The Highs
If the effects of a single entity quickly gaining control of a significant portion of supply influenced the upward price movements, the unwinding of this supply likely contributed to the sustained decline since June.
PlusToken coins first entered mixing on 7 August with active distribution beginning a few days later. Coin distribution remained relatively consistent between mid-August and late November, a roughly 100-day period.
Assuming a constant distribution of our 105,600 BTC total yields a daily distribution rate of 1,050 BTC or roughly 58% of the daily miner block reward. This distribution likely had a significant downward effect on price action in the latter half of the year.
Figure 15 below shows detailed distribution data from the beginning of November through the end of December. Throughout most of November, daily distribution typically ranged from 250 to 2500 BTC.
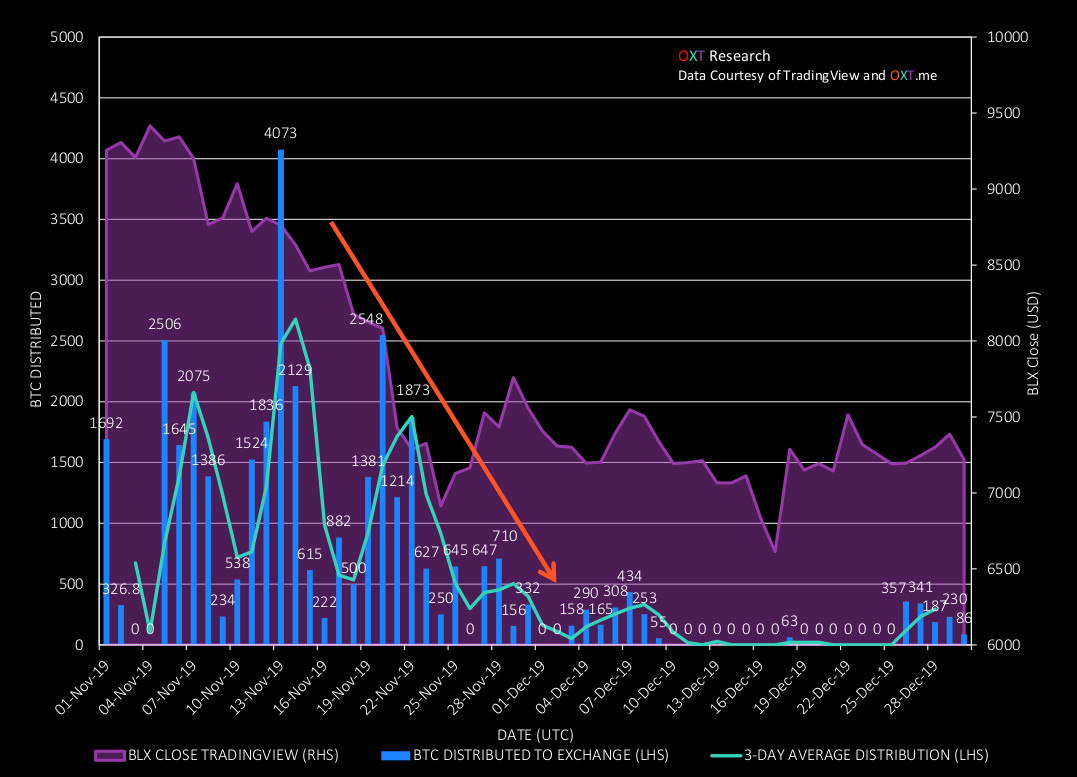
Slowing Distribution
Distribution has slowed significantly after 22 November to typically less than 500 BTC per day with 0 distributions during a significant portion of December.
The significant decline in coin distribution throughout December may have been in response to the late November price drop or to avoid flooding the holiday market with excess supply.
We performed a simple regression analysis looking for correlation between price change and PlusToken coin distribution for November. Correlation over a daily and 3-day time frame were evaluated. Neither time frame produced a statistically significant correlation. The daily regression is shown below.
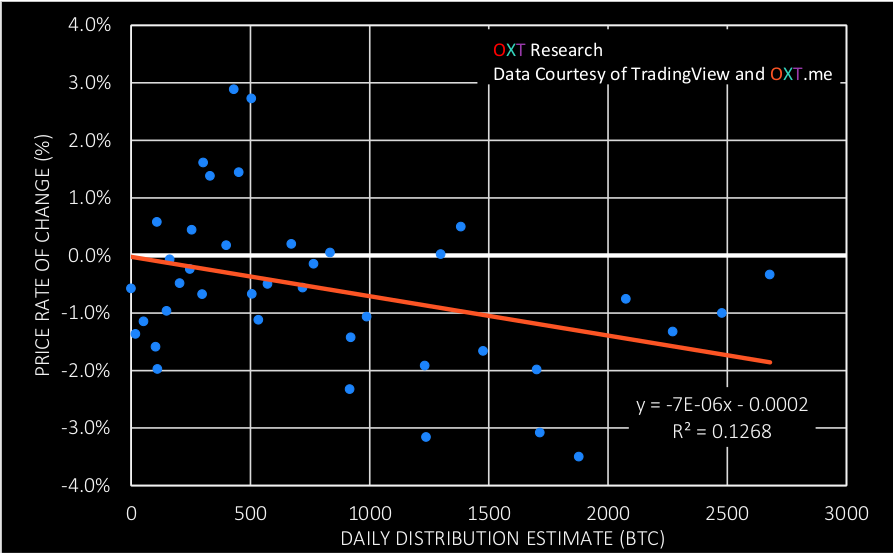
The lack of correlation may indicate that some portion of coins are not immediately offered for sale and have a delayed effect on price.
Speculation
How could we be wrong?
There have only been a few dozen multi-billion dollar ponzi schemes in human history. PlusToken is likely the first multi-billion dollar cryptocurrency based ponzi scheme. We independently verified the overall PlusToken pre-mix cluster via screenshots of in-app PlusToken wallet tutorials, a relatively strong evidence of address control.
We also successfully documented the movement of the majority of the coins in our cluster through similar mixing methods before distribution by a similar process to similar destinations. This is further evidence of common ownership and attempted hiding of funds attributable to the movement of stolen crypto.
One of our biggest questions regarding the totals above pertains to the unmixed and unmoved funds from June, August, and September. The status of these coins remains questionable due to limited data outside of movement timings and links to mixed coins. It is possible these coins have been lost, but we have included them in our totals until additional evidence provides further clarity on their status. There has been no formal news regarding PlusToken related arrests since 27 June. The supposed CEO's of PlusToken were not among those reportedly arrested.
Again, it is worth noting that we are not watching the Huobi order book and that distribution to Huobi hot wallets and possible OTC addresses does not imply coins going immediately up for sale.
How could PlusToken be a multi-billion dollar ponzi?
The total value of PlusToken's cryptocurrency hoard is well in excess of just the bitcoin denominated value. PlusToken's self-reported user base of 2.4 to 3 million [1] users should be looked at with skepticism.
If this number of participants is directionally correct, an average "investment" of $1000 per participant can easily account for the majority of PlusToken's inflows.
The token based crypto MLM scheme will likely be a recurring theme of OXTs reports. These scams seem to largely be Asia based and look to pray on new cryptocurrency participants. There is likely a cultural aspect to the psychology and susceptibility of people to these types of scams. Tianxi Group [22], a wellness and ant-farm ponzi scheme based in China, is an example of the absurdity and susceptibility to people to these scams.
We will likely cover this type of psychology and marketing of these schemes in further research reports. If any readers have additional information that could aid in our analysis and tracking of these types of scams, please reach out to us.
Why does Huobi appear complicit in the processing of these coins?
It is unlikely that Huobi is unaware of these massive inflows. In the past, Huobi has responded to attempted selling of stolen crypto on their platform by freezing accounts and blacklisting addresses [23].
As Huobi cannot stop the inflow of coins into their exchange, they may be placing some internal controls on these coins as part of their KYC process.
Though Huobi has recently re-domiciled outside of China, they reportedly [24] maintain close ties with the Chinese Communist Party. Given China's repeated crypto-crackdowns, we don't expect the CCP would look kindly on attempted laundering through Huobi. At the very least, we expect that Huobi has received some type of blessing from the CCP to process these coins.
It is also possible that due to the poor mixing of the PlusToken coins, Huobi is acting as a "custodial" tumbler. In this scenario coins may be entering one hot wallet and leaving another for selling on other exchanges. This completely breaks any blockchain links between deposits and withdrawals.
Although the growth in Huobi's total BTC assets suggests otherwise, we may investigate the flows between Huobi and other Asian exchanges.
While much of the above regarding the processing of these coins remains speculation, one thing remains certain
After the 27 June shutdown, a significant majority of PlusToken's coins have gone through an attempted mixing process before distribution. At least 80% of the mixed coins have been distributed or are currently in distribution.
Traders and investors should be aware that Huobi continues to be a major destination of these coins and we estimate that 55,000 to 75,000 BTC remain to be distributed.
Analysis Validation
PlusToken reporting has generally been scattered and inconsistent. Most information comes from a handful of news articles reporting a 200,000 BTC total based on the behavior of a few addresses in the overall cluster. As described above, this analysis is overly simplistic and likely accounts for the same coins multiple times due to the significant self-transfer observed in our cluster.
There are limited analyses on PlusToken's on-chain movements. One analysis was completed by Elementus focusing on PlusToken's ETH. Another was completed by Chainalysis in a blog post that focused on BTC and concluded the following:
- A total of 180,000 BTC were tracked from scam victims to PlusToken Wallets.
This is roughly in line with our post-shut down totals. - 20,000 BTC is currently spread out among more than 8,700 addresses.
This corresponds to our "unaccounted" for total of 24,000 BTC. - 25,000 BTC has been cashed out.
Our distributions totals are approximately four times this number.
The Chainalysis blog post is extremely opaque and we are unable to verify this analysis due to a lack of references including pre-mix addresses and clusters, post-mix addresses, and most importantly distribution transaction IDs.
If the bitcoin blockchain is entirely transparent, why should market participants rely on blackbox analyses to inform investment decisions?
Next Steps
The OXT (Open eXploration Tool) Research team is supported by a group of bitcoin users passionate about privacy and transparency. OXT was created with these ideals in mind and remains the most powerful freely available blockchain research platform.
In keeping with these ideals, a complete list of referenced pre-mix addresses and clusters, post-mix addresses, and distribution transaction IDs used for our analysis is available for download below
We welcome peer review by other analysts.
Conclusion
We have been tracking the PlusToken situation closely since September 2019. After evaluating the size of the PlusToken scam, we believe it was a significant driver of the 2019 price advance and protracted decline since June.
To summarize the conclusions of this report:
- PlusToken was the first multi-billion dollar crypto currency ponzi scheme.
- PlusToken's post-shut down BTC holdings are approximately 187,000 BTC.
- Including pre-shutdown distributions, PlusToken's total hoard likely exceeded 1% of BTC's total supply.
- Roughly 139,000 BTC of the post-shut down holdings have been mixed with at least 80% (105,000 BTC) of mixed coins distributed to Huobi and other destinations.
- At least 55,000 BTC remain unmixed or undistributed.
- PlusToken net accumulation during the most active period of 2019 was approximately 1200 BTC per day (65% of the daily mining reward).
- After shutdown, the PlusToken coins were distributed at a rate of at least 1050 BTC per day (58% of the daily mining reward) during a period between mid-August and late-November.
- The distribution of PlusToken coins has slowed significantly throughout late November and December.
The tracking of PlusToken funds between entities in our overall cluster has been complicated by both significant self-transfer and the use of mixing services.
Our analysis leveraged the power of the OXT platform in combination with unique knowledge of bitcoin mixers and a flexible targeted evaluation to track the movement of PlusToken funds.
The OXT Research Team is intimately familiar with the tracking of PlusToken coins and analysis of other special situations affecting bitcoin markets. With the help of the OXT platform, we remain uniquely situated to provide targeted transparent analysis of this and other special situations affecting bitcoin.
Due to the significant volume of PlusToken coins that have yet to be distributed, we expect PlusToken will have continued effects on the bitcoin exchange rate through 2020.