PlusToken Impact Update
In the first issue of Special Situation Report, we peeled back the layers to reveal the facts around the first multi-billion dollar cryptocurrency ponzi scheme, PlusToken.
Previously, we introduced estimates for the size of the PlusToken scam and assessments of market impacts based on the accumulation and distribution of PlusToken's massive hoard.

Though we had collected some detailed distribution data, the report was relatively vague, particularly regarding the active distribution of PlusToken's hoard. For this report we have prepared detailed and refined data including:
- Updates on unmixed, mixed, and distribution volumes
- BTC and USD distribution estimates for PlusToken's post-shut down period
- Updated distribution destinations
- PlusToken gains a new mixing participant
- New mixer inflows
- A discussion of the remaining coins and market impacts
Accounting Review
We have used the following terms to account for coins as they transition through the PlusToken distribution process.
Unmixed Coins
Coins associated with our original PlusToken cluster that have not entered mixing. These include coins that were simply transferred from our overall cluster after shutdown, as well as coins directly associated with mixer deposits.
Mixing Coins
These refer to coins that are deposited into the "mixing" process. Roughly 20,000 BTC were deposited into the Wasabi wallet mixer. Over 150k BTC were mixed through a simple algorithmic process we have termed "self-shuffling".
Distributed Coins
Mixer outputs are consolidated into single output transactions with outputs typically greater than 100 BTC. After consolidation, coins are distributed in a "peeling" chain, with large chunks peeled from a main distribution branch and sent to exchanges.
Revised Overall Coin Accounting
We found several additional sources of previously unaccounted for coins. Including these coins increases our post-shutdown PlusToken hoard estimate to 200,966 BTC.
While gathering our refined distribution data, we noted additional mixer deposits sourced from our overall PlusToken cluster. These new sources have been included in Table 1 below. Our estimates from Issue 1 are provided for comparison.
| Issue 1 Report | Issue 2 Report | Change (BTC) | |
|---|---|---|---|
| New Mix Deposits | 0 | 25,537 | 25,537 |
| Unmixed BTC | 48,856 | 23,319 | (25,537) |
| Mixed BTC | 138,790 | 177,647 | 38,857 |
| Total BTC | 187,646 | 200,966 | 13,320 |
| Distributed and Distributing | 111,011 | 143,775 | 32,764 |
We should note that this new total includes mixer deposits from a new mixing participant, which is discussed later in this report.
The distributed/distributing volume change is largely due to coins that were previously distributed in August and September that we had not formally accounted for. Roughly 14,000 BTC in new distributions have taken place since our last report.
Approximately 23,319 BTC remain "unmixed". Further discussion of these coins is provided at the end of this report.
The relevant address changes and revised detailed accounting breakdown is included in our attached data spreadsheet (see PlusToken Pre-mix and Mixer Inflow Accounting Table).
Distribution Review
The PlusToken coins have generally flowed from our overall pre-mix addresses and clusters (we refer to these coins as "unmixed") into mixing. Mixer outputs are then consolidated and distributed.
Our accounting uses mixer inflows and outflows as a benchmark for tracking coin totals.
We are not watching the exchange order books and use the term distribution to refer to the process of depositing coins into exchange wallets.
- Mixer inflows are used to account for the overall size of the PlusToken hoard post-shut down.
- Mixer outflows are monitored for distribution and transfer to other wallets and exchanges.
- The difference between mixer inflows and outflows are used to estimate coins remaining in the mixing process that have yet to be distributed.
Distribution Methodology
We characterize distribution as the process of consolidating mixer outputs followed by "peeling" distributions to exchanges in separate branches.
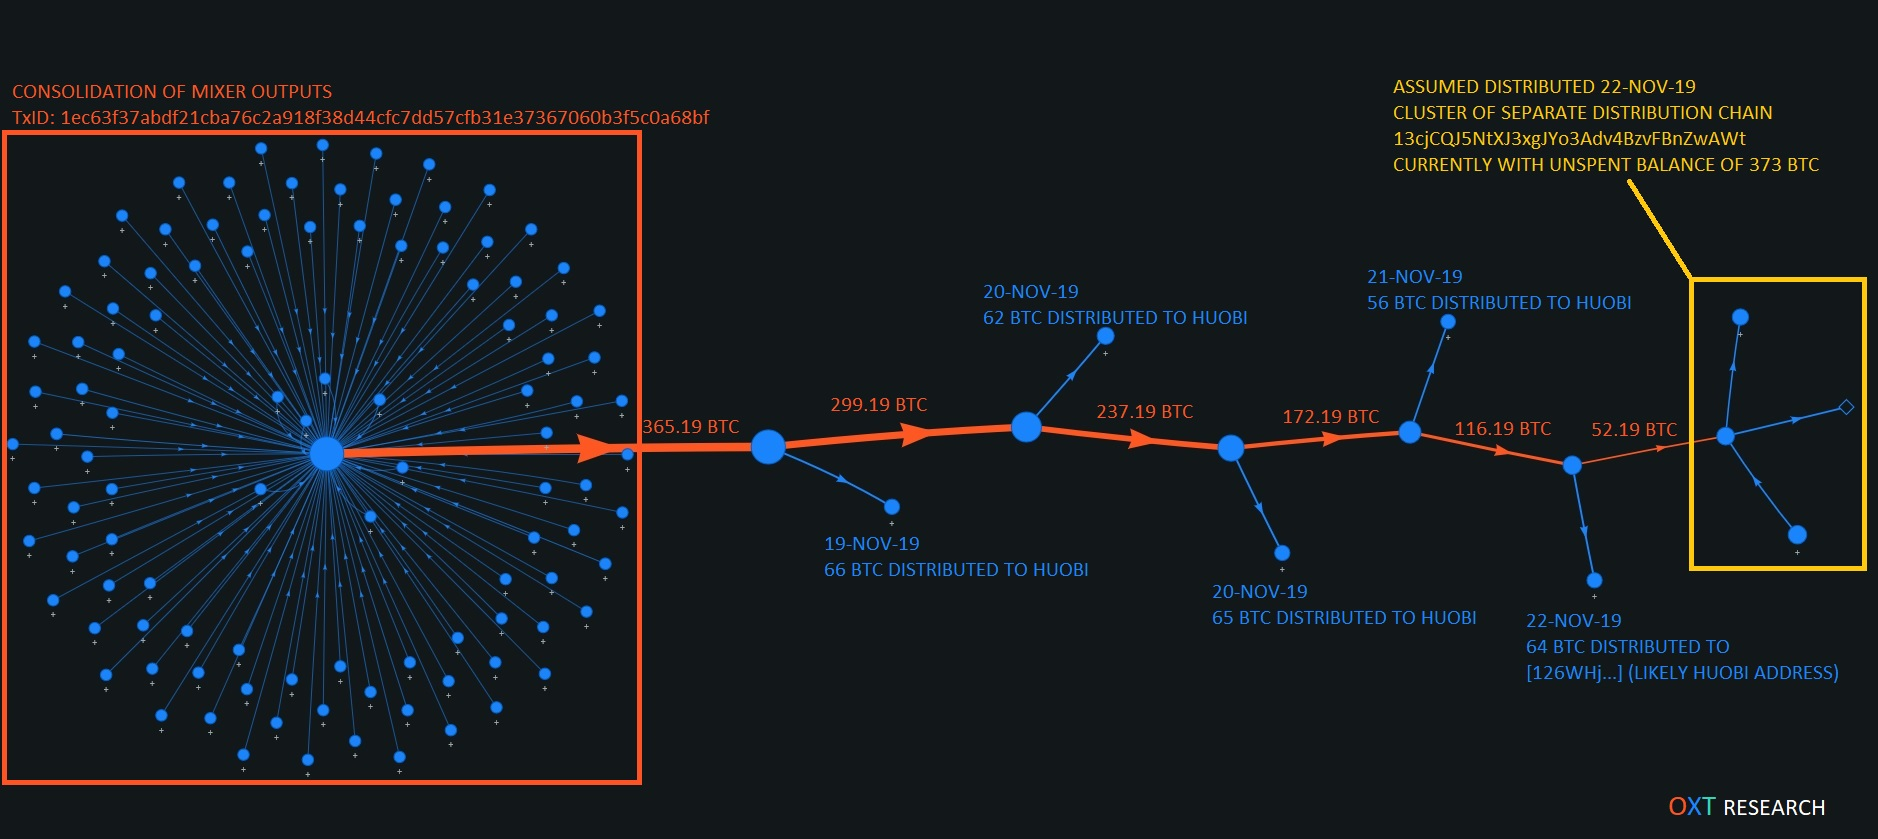
A typical post-mix consolidation and distribution process is provided in Fig. 1 above.
A complete list of over 850 post-mix consolidation transactions and their daily distribution estimates are included in our attached spreadsheet for review and custom analysis. We welcome peer review and can be contacted with any comments or questions.
Revised Distribution Accounting
In this report, our research efforts have been centered around refining daily distribution estimates for the post-shut down PlusToken distribution period (August 2019 to present).
In Issue 1 we had "accounted for" roughly 111,000 BTC including various assumptions. We use the term "accounted for" as a combination of totaled distributions and other assumptions to estimate the coins remaining in the mixing process ("unaccounted for"). We estimated between 4k and 24k BTC remained in mixing.
In the process of evaluating our refined daily distribution data, we accounted for roughly 18,000 additional BTC that were distributed between August and November.
It's unlikely that we have accounted for every single coin that has been distributed, as a result we believe our conclusions represent "upper bound" estimates of the remaining coins.
The purpose of the Table 2 (see last row) is to account for the difference between our mixer inflows and outflows and develop an upper bound estimate of coins that have entered mixing but not yet been distributed.
Approximately 80% of coins entering mixing have been distributed while up to 33,872 BTC remain in the mixer and 3,853 BTC are in the distribution process, resulting in a total of 37,725 BTC that have entered mixing, but not yet been distributed.
| Issue 1 Report | Issue 2 Report | Change (BTC) | |
|---|---|---|---|
| Mixed | 138,790 | 177,647 | 38,857 |
| DISTRIBUTED (Accounted For) | 100,482 | 139,922 | 39,440 |
| DISTRIBUTED (Assumed) | 5,133 | 0 | (5,133) |
| DISTRIBUTING (Current Batch Distributed) | 2,409 | 0 | - |
| DISTRIBUTING (Current Batch Remaing) | 2,987 | 3,853 | - |
| NEXT DISTRIBUTION BATCH (Remaing) | 0 | 0 | 0 |
| ASSUMED MIXING (Lower Bound) | 4,000 | 0 | (4,000) |
| ACCOUNTED FOR | 111,011 | 143,775 | 32,764 |
| MIXING UPPER BOUND | 27,779 | 33,872 | 6,093 |
| MIXED BUT NOT DISTRIBUTED | 30,766 | 37,725 | 6,959 |
Detailed Distribution Tracking
Throughout January and February, we have diligently tracked down as many PlusToken post-mix consolidation transactions as possible to obtain more accurate estimates of daily distribution rates.
We began detailed daily distribution accounting in November. Shortly after publishing our initial tweet thread on 21 November, distribution slowed significantly and stalled for most of December.
I’ve been seeing a lot of Twitter FUD opining on miner capitulation in the last few days.
— 🏴∴glorified accountant∴🏴 (@ErgoBTC) November 21, 2019
This got me thinking… could the selling by the PlusToken scammers have had an abnormal effect on this market cycle? pic.twitter.com/VZGjyQAxaF
Despite the obvious signs of on and off distribution, we included a simplified daily distribution estimate of 1100 BTC/day in our initial report in Issue 1.
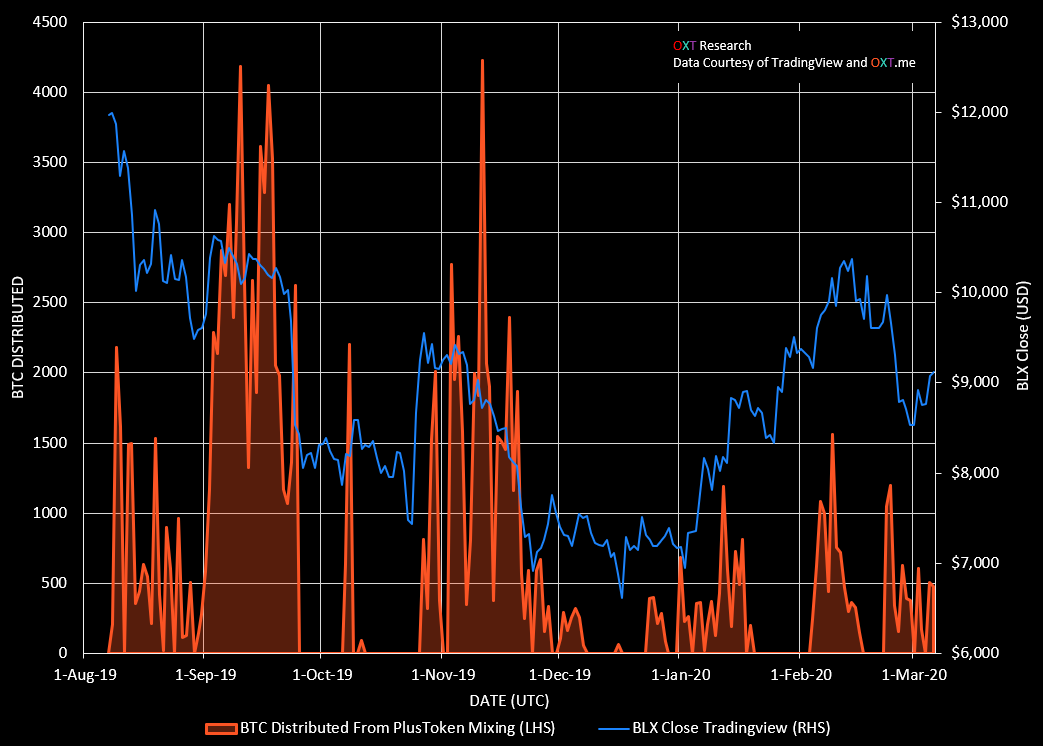
Our updated daily distribution rate estimates can be reviewed in Fig 2 below.

Drawing Conclusions
We can draw a few conclusions from the daily distribution rates. We can see that distribution was not consistent as implied by our January report
Additionally, distributions were highest into the September and November price strength, peaking at nearly 4500 BTC per day. October and December saw muted distribution into price weakness.
The cumulative coin distribution of our 139,922 BTC accounting is provided in Fig.3.
PlusToken coin distribution appears to increase into price strength and decrease into price weakness. Recent distributions appear to be highly price sensitive. Coin distribution may increase into continued price strength.
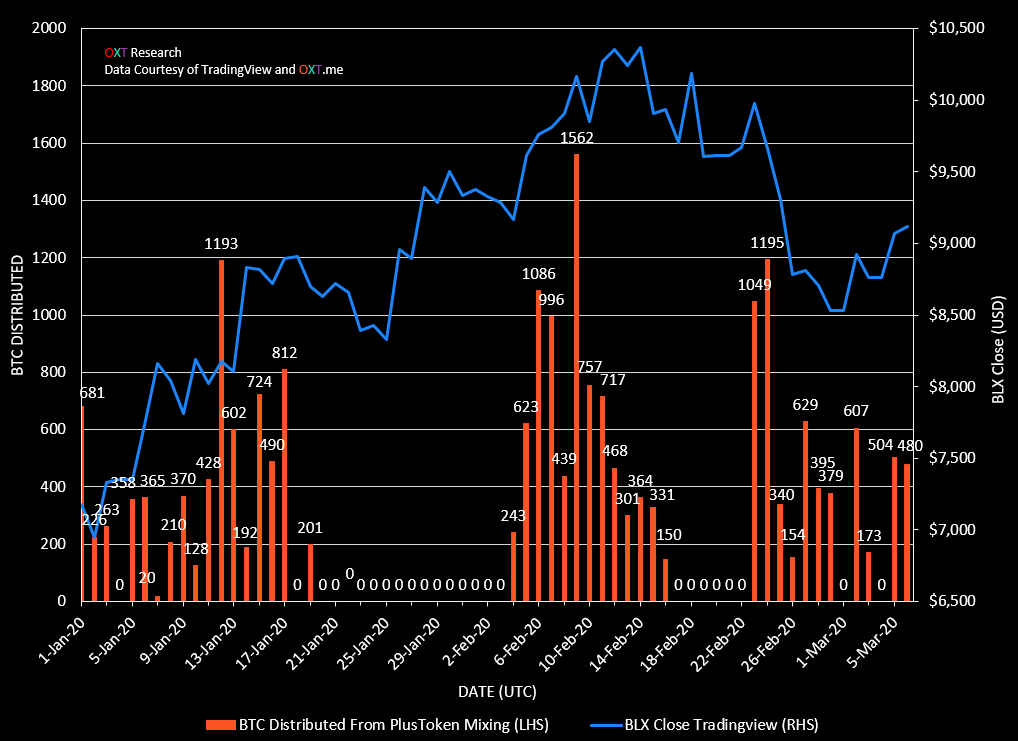
January & February 2020
7,262 BTC were distributed in January 2020 and 12,178 BTC were distributed in February 2020.
Distributions in January and February have been volatile, but lower than the levels seen in September and November.
Distribution appears to increase into market strength and pause with market weakness.
Detailed USD Value of Distribution
Given the apparent systematic coin distribution, we expect that distributed coins are sold relatively shortly after distribution to exchanges.
Assuming coins are sold on their distribution date at the BLX closing price produces the following daily distribution USD values.
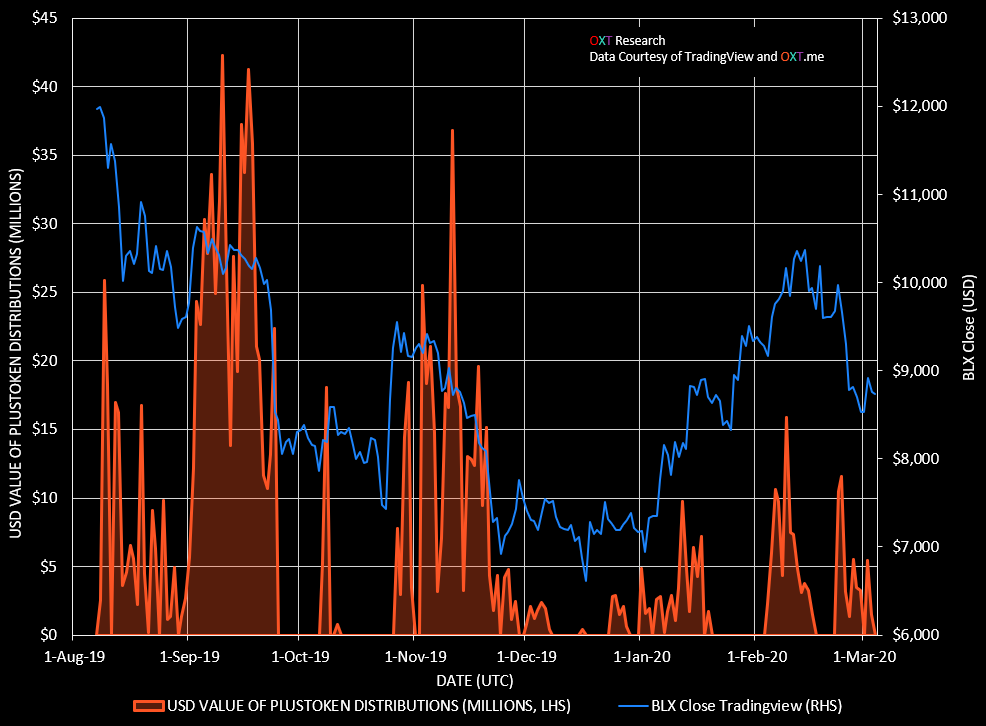
The cumulative distribution of our 139,922 BTC accounting results in over $1.3 billion in distribution from PlusToken from August 2019 through 6 March 2020.
Peak distribution resulted in daily spikes to $45,000,000 per day in September. Monthly BTC and equivalent USD distribution values are provided in Table 3.
| Month | BTC Distributed | USD Value |
|---|---|---|
| Aug 2019 | 14,823 | 160,718,880 |
| Sep 2019 | 57,813 | 590,308,807 |
| Oct 2019 | 7,979 | 71,015,143 |
| Nov 2019 | 35,266 | 304,679,801 |
| Dec 2019 | 2,878 | 20,973,167 |
| Jan 2020 | 7,262 | 59,029,221 |
| Feb 2020 | 12,178 | 118,862,149 |
| Through 6 March 2020 | 1,764 | 6,929,535 |
| TOTAL | 139,992 BTC | 1,332,516,702 USD |
Where are the PlusToken coins going?
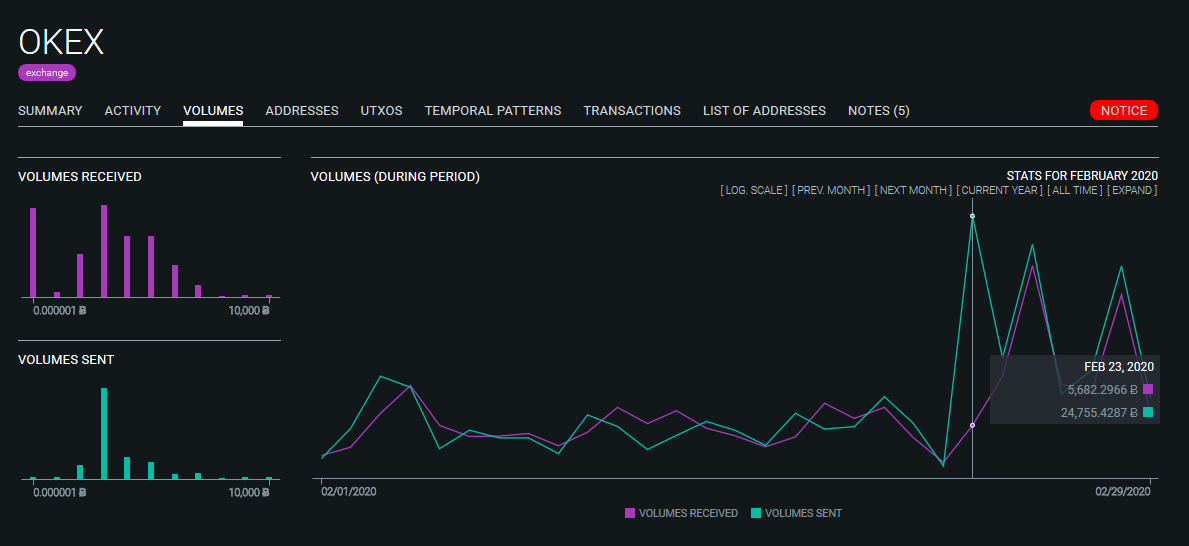
During the evaluation of our refined distribution data we noted OkEx. OkEx is a newly labeled and significant coin destination having received nearly 50% of February distributions.
Early August:
- Minor inflows into Binance and Bittrex. This generally confirms some of the early reports on PlusToken's distribution.
August through early January
- Address [14scL4...] Possible OTC/Investment Fund.
Entire disbursement period
- Possible Exchange Clusters (ANON-2115747235 and ANON-2310906718).
- Huobi, which remains one of the most significant coin destinations.
- OkEx (previously ANON-160174884)
A new mixing participant...
2019 saw the rise of the custodial "superwallet" that promised to pay users for "hodling" crypto. Through a combination of ponzi marketing and unrealistic returns, these projects have drawn inflows of thousands of BTC on top of PlusToken's massive hoard.
PlusToken was the first and largest of these schemes, but other noteworthy ponzi wallets include PlusToken copycats WoToken and CloudToken. With the help of others, we have performed preliminary labeling of addresses and clusters associated with WoToken and CloudToken.
Based on our preliminary analysis, these PlusToken copycats accumulated on the order of 1/10th the total hoard of PlusToken. Most of these coins have likely been distributed to exchanges for active trading.
However, one noteworthy address associated with WoToken became active a few days after identification.
2649 BTC via address 1C4PZb... originating from the WoToken cluster (ANON-2019425157) entered the self-shuffling process with the PlusToken coins on 9 January 2019.

The relationship between PlusToken and WoToken
These coins have been directly involved in mix transactions with the PlusToken coins and are now linked to the most recent PlusToken coin distributions.
For now, we speculate two scenarios regarding the relationship of these two scams:
Scenario 1
On the lower end of relationship, the scammers stumbled onto the same algorithmic mixer in hopes of laundering their stolen funds before distributing to exchanges.
Scenario 2
On the high end of relationship, the same entity is in control of the coins from both scams.
In the 2 months since these coins have entered mixing, we have not been able to distinguish any obvious volumes exiting mixing corresponding to the 2649 BTC deposit.
We lean toward the higher end relationship scenario — that a single entity controls the coins of both scams — and have incorporated the 2649 BTC into our overall totals.
Remaining PlusToken Coins
Over 80% of PlusToken coins entering mixing have been distributed, totaling 139,922 BTC in distribution since early August.
Recently, we have noted several new mixer deposits from addresses responsible for mixer deposits in August and September. These new mixer deposits are detailed below:
- 11 Feb 2020
- 12,424 BTC via addresses [1Li4mU...] and [1H2zrV...]
- 5 Mar 2020
- 13,298 BTC via addresses [1Gc91z...]and [15pyB7...]
We believe the coins that have entered mixing, totaling 37,725 BTC, will eventually be distributed.
| BTC | |
|---|---|
| Mixed But Not Distributed (Upper bound) | 37,725 |
| Unmixed - Associated with Mixer Deposits | 185 |
| Unmixed - Associated with Overall Cluster | 23,319 |
| Upper Bound Total | 61,229 BTC |
Assuming the remaining 23,504 BTC that have not entered mixing are also distributed, a total of 61,229 BTC remain undistributed.
Market Impact
After taking into account our revised accounting, PlusToken has distributed nearly 70% of their entire hoard. Peak distributions occurred in September and November coinciding with a weaker market.
As a result, most of the PlusToken market impacts have likely passed.
That being said, up to 61,229 BTC remain undistributed. These coins may still have a market impact that will largely depend on overall market conditions and the rate of distribution.
We present two possible scenarios for the coins that have not been distributed.
Scenario 1
Only the 37,725 BTC remaining in mixing are distributed.
Scenario 2
All 61,229 BTC remaining coins are distributed
Due to the limited available data on the remaining unmixed coins, we consider the second scenario less likely.
PlusToken coin distribution appears to increase into price strength and may continue to increase into price strength. However, recent January and February distributions have been highly price sensitive, pausing abruptly into short term market weakness.
Given the apparent price sensitivity of recent distribution, we expect that distributions will not rise to the levels seen in September and November. However, distribution may increase into price strength and stall market rallies.
Conclusions
We have been tracking the PlusToken situation closely since September 2019. After evaluating the size of the PlusToken scam, we believe it was a significant driver of the 2019 price advance and protracted decline since June.
In this report, we have further refined our analysis of the movement and tracking of PlusToken coins and conclude the following:
- Our estimates of PlusToken's post-shutdown hoard stands at roughly 198,317 BTC, excluding WoToken's mixer contributions.
- 177,647 BTC have entered mixing with at least 139,922 BTC distributed since August 2019.
- PlusToken coin distribution volume was not consistent, with heaviest distribution occurring into price strength in September and November.
- Assuming coins are sold on the date of distribution to exchanges, PlusToken's distributions total over $1.3 billion between August 2019 and early March 2020.
- OkEx and Huobi have received a significant portion of the PlusToken coins.
- PlusToken has gained a new mixing participant with 2649 BTC deposited into self-shuffling from WoToken associated clusters.
- Having distributed nearly 70% of their total hoard, most of PlusToken's market effects have largely passed.
- Recent distribution rates have been volatile but may increase into market rallies as seen in September and November.
- Currently we favor up to 37,725 BTC will be distributed from the PlusToken mixer, but up to 61,229 BTC have not yet been distributed.
Our analysis leveraged the power of the OXT platform in combination with unique knowledge of bitcoin mixers and a flexible targeted evaluation to track the movement of PlusToken funds.
The OXT Research Team is intimately familiar with the tracking of PlusToken coins and analysis of other special situations affecting bitcoin markets. With the help of the OXT platform, we remain uniquely situated to provide targeted transparent analysis of this and other special situations affecting bitcoin.